As is known, dry air(CB) consists of 78% nitrogen, 21% oxygen and about 1% carbon dioxide, inert and other gases. If there are in the air, then such air is called moist air(BB). Considering that when ventilating rooms, the composition of the dry part of the air practically does not change, and only the amount of moisture can change, in ventilation it is customary to consider explosives as a binary mixture consisting of only two components: SW and water vapor (VP). Although all gas laws apply to this mixture, during ventilation we can assume with sufficient accuracy that the air is almost always under atmospheric pressure, since the fan pressures are quite low compared to barometric pressure. Normal atmospheric pressure is 101.3 kPa, and the pressures developed by fans are usually no more than 2 kPa. Therefore, heating and air in ventilation occur at constant pressure.
Among the thermodynamic parameters of explosives that are used in the course of ventilation, we can distinguish following:
- density;
- heat capacity;
- temperature;
- moisture content;
- partial pressure of water vapor;
- relative humidity;
- dew point temperature;
- enthalpy (heat content);
- wet bulb temperature.
Under the influence of various factors, it can change its parameters. If air contained in a certain volume (for example, a room) is in contact with hot surfaces, it warms up, that is, its temperature rises. In this case, those layers that border the hot surfaces are directly heated. Due to heating, , changes, and this leads to the appearance convective currents: a process of turbulent exchange occurs. Due to the presence of turbulent mixing of air in the process of vortex formation, the energy absorbed by the boundary layers is gradually transferred to more distant layers, as a result of which the entire volume of air somehow increases your temperature.
From the example considered, it is clear that layers close to hot surfaces will have a higher temperature than layers distant. In other words, the temperature throughout the volume is not the same (and sometimes differs quite significantly). Therefore, temperature, as an air parameter, at each point will have its own individual, local value. However, the nature of the distribution of local temperatures throughout the volume of the room is extremely difficult to predict, so in most situations we have to talk about a certain average value of one or another air parameter. Average temperature is derived from the assumption that the perceived heat will be evenly distributed throughout the air volume, and the air temperature at each point in space will be the same.
The issue of temperature distribution along the height of the room has been more or less studied, however, even in this matter, the distribution pattern can change greatly under the influence of individual factors: jet currents in the room, the presence of shielding surfaces building structures and equipment, temperature and size of heat sources.
The atmospheric air around us is a mixture of gases. It is almost always wet. Water vapor, unlike other components of the mixture, can be in the air, both in a superheated and saturated state. The content of water vapor in the air changes, both during the process of moisture treatment in supply ventilation systems and air conditioners, and during the assimilation of moisture emissions in the room by air. The dry part of humid air usually contains (by volume): about 75% nitrogen, 21% oxygen, 0.03% carbon dioxide and a small amount of inert gases - argon, neon, helium, xenon, krypton), hydrogen, ozone and others. The indicated components of the gas mixture of air make up its dry part, the other part of the air mass is water vapor.
Air is considered as mixture of ideal gases, which allows you to use the laws of thermodynamics to obtain calculation formulas.
According to Dalton's law, each gas in the mixture that makes up air occupies its own volume and has its own partial pressure
P i ,
and has the same temperature as the other gases in this mixture.
Attention! Important definition:
The sum of the partial pressures of each of the components of the mixture is equal to the total barometric pressure of the air.
B = Σ Р i, Pa.
Let's consider the concept of what is partial pressure ?
Partial pressure- this is the pressure that the gas included in this mixture would have if it were in the same quantity, in the same volume and at the same temperature as in the mixture.
In ventilation calculations, we consider humid air as a binary mixture, i.e. a mixture of two gases, which consists of water vapor and dry air. We conventionally consider the dry part of the air to be a homogeneous gas.
Thus, barometric pressure equal to the sum of the partial pressures of dry air P r.v. and water vapor P p , i.e.,
B = P r.v. +P p
Under normal indoor conditions, when the water vapor pressure R p approximately equal to 15 mm. rt. Art., share of the second term P r.v. in the barometric pressure formula, taking into account the difference in the density of moist and dry air, all other things being equal, is only 0.75% of the density of dry air ρ r.v. . Therefore, in our engineering calculations it is considered that
ρ air = ρ r.v.
ρ air = ρ r.v.
When air humidity changes during ventilation processes, the mass of its dry part remains unchanged. Based on this, it is customary to refer the mass of water vapor contained in the air to 1 kg. dry part of the air.
Let's move directly to those physical quantities, which determine the parameters of humid air. It is the combination of these parameters that determines the state of humid air:
this is a quantity that characterizes degree of body heating. It is a measure of the average kinetic energy of the translational motion of molecules. The Celsius temperature scale and the Kelvin thermodynamic temperature scale, which is based on the second law of thermodynamics, are currently used. There is a relationship between temperatures expressed in degrees Kelvin and degrees Celsius, namely:
T, K = 273.15 + t °C
It is important to note that the state parameter is the absolute temperature, expressed in Kelvin, but the degree of the absolute scale is numerically equal to the degree Celsius, i.e.
dT = dt.
Air humidity is characterized by the mass of water vapor it contains. The mass of water vapor in grams per 1 kg of dry part of moist air is called air moisture content d, g/kg.
Magnitude d is equal to:
Where: B
– barometric pressure equal to the sum of the partial pressures of dry air.
P r.v.
and water vapor P p
;
P p
– partial pressure of water vapor in unsaturated humid air.
Magnitude φ equal to the ratio of the partial pressure of water vapor in unsaturated moist air P p. to the partial pressure of water vapor in saturated humid air P n.p. at the same temperature and barometric pressure, i.e.,

At a relative humidity of 100%, the air is completely saturated with water vapor, and it is called saturated humid air , and the water vapor contained in this air is in a saturated state.
If φ < 100%, then the air contains water vapor in a superheated state and is called unsaturated moist air .
The pressure of water vapor in a saturated state depends only on temperature. Its value is determined experimentally and given in special tables. There are a number of formulas that approximate the dependence Pn.p. V Pa or in mm. rt. st. from temperature in t °C.
For example, for the region of positive temperatures from 0°C and higher, the pressure of saturated water vapor in Pa is approximately expressed by the relationship:
P n.p. = 479 + (11.52 + 1.62 t) 2, Pa
Using the concept of relative humidity φ , air moisture content can be determined as

For ventilation processes, the temperature range is a constant value and is equal to
From r.v. = 1.005 kJ/(kg ×°C).
In the typical temperature range for ventilation processes, this value can be considered constant and equal to
C p = 1.8 kJ/(kg × °C).
J s.v. = From r.v. ×t,
Where: t – air temperature, in °C.
Enthalpy of dry air J s.v. at t = 0°C taken equal to 0.
for water at t = 0°C equal to 2500 kJ/kg.
in air at any temperature t, is
J p = 2500 + 1.8 t.
consists of the enthalpy of its dry part and the enthalpy of water vapor.
Enthalpy J humid air, referred to 1 kg dry part of moist air, in kJ/kg, at arbitrary temperature t and arbitrary moisture content d, is equal to:

Where: 1,005
– C r.v. heat capacity of dry air, _kJ/(kg×°C);
2500
– r specific heat vaporization, kJ/(kg×°С);
1,8
– C p heat capacity of water vapor, kJ/(kg×°С).
If the air transmits obvious warmth, it heats up, i.e. his temperature rises. When moist air is heated, enthalpy changes as a result of changes in the temperature of the dry part of the air and water vapor. When water vapor with the same temperature enters the air from external sources (isothermal steam humidification), it is transferred latent heat vaporization. The enthalpy of moist air also increases, because the enthalpy of water vapor is added to the enthalpy of the dry part of the air. At the same time, the air temperature remains almost unchanged, which was the reason for the introduction of this term - latent heat.
In general, the enthalpy of moist air consists of sensible and latent heat, so enthalpy is sometimes called total heat.
For further calculations of ventilation and air conditioning systems, we will need the following basic parameters of moist air:
- temperature t in , °C ;
- moisture content d in , g/kg ;
- relative humidity φ in , % ;
- heat content J in , kJ/kg ;
- concentration of harmful impurities WITH , mg/m 3 ;
- travel speed V in , m/sec.
1. Absolute humidity.
Mass amount of steam in 1 m 3 of air –
2. Relative humidity.
The ratio of the mass amount of steam in a steam-air mixture to the maximum possible amount at the same temperature
 (143)
(143)
Mendeleev–Clapeyron equation:

For steam
Where: 
To determine the relative humidity of the air, a “psychrometer” device is used, consisting of two thermometers: wet and dry. The difference in thermometer readings is calibrated into values.
3. Moisture content.
The amount of steam in the mixture per 1 kg of dry air.
Let us have 1 m 3 of air. Its mass is .
This cubic meter contains: - kg of steam, - kg of dry air.
Obviously: ![]() .
.
4. Enthalpy of air.
It is made up of two quantities: the enthalpy of dry air and steam.
5. Dew point.
The temperature at which a gas of a given state, cooling at a constant moisture content (d=const), becomes saturated ( = 1.0), is called the dew point.
6. Wet bulb temperature.
The temperature at which a gas, when interacting with a liquid, cooling at a constant enthalpy (J=const), becomes saturated ( = 1.0), is called the wet-bulb temperature t M .
Air condition diagram.
The diagram was compiled by the domestic scientist Ramzin (1918) and is presented in Fig. 169.
The chart is for average atmospheric pressureР=745 mm Hg. Art. and is essentially an isobar of the equilibrium of the vapor - dry air system.
The coordinate axes of the J-d diagram are rotated at an angle of 135 0. At the bottom there is an inclined line to determine the partial pressure of water vapor Pn. Dry air partial pressure
The diagram above shows a saturation curve ( =100%). The drying process in the diagram can only be represented above this curve. For an arbitrary point “A” on the Ramzin diagram, the following air parameters can be determined:
 Fig. 169.
J-d diagram conditions of humid air.
Fig. 169.
J-d diagram conditions of humid air.
Drying statics.
In the process of convective drying, for example, with air, the wet material interacts and comes into contact with a steam-air mixture, the partial pressure of water vapor in which is . Moisture can leave the material in the form of steam if the partial pressure of steam in a thin boundary layer above the surface of the material or, as they say, in the material P m is greater.
Driving force drying process (Dalton, 1803)
![]() (146)
(146)
In equilibrium =0. The moisture content of the material corresponding to the equilibrium condition is called the equilibrium moisture content (U p).
Let's conduct an experiment. In the chamber of the drying cabinet at a certain temperature (t=const) we place an absolutely dry substance on long time. At a certain air level in the cabinet, the moisture content of the material will reach U p. By changing , you can obtain a curve (isotherm) of moisture sorption by the material. As it decreases, the desorption curve appears.
 Figure 170 shows the sorption-desorption curve of wet material (equilibrium isotherm).
Fig. 170. Equilibrium isotherm of wet material with air.
1-region of hygroscopic material, 2-hygroscopic point, 3-region of wet material, 4-sorption region, 5-desorption region, 6-drying region.
There are equilibrium curves:
1. hygroscopic
2. non-hygroscopic material.
 The isotherms are shown in Fig. 171.
Fig. 171. Equilibrium isotherms.
a) hygroscopic, b) non-hygroscopic material.
Relative humidity in the dryer and in the atmosphere.
After drying, upon contact with atmospheric air, the hygroscopic material significantly increases the moisture content (Fig. 171 a) due to the adsorption of moisture from the air. Therefore, after drying, hygroscopic material must be stored in conditions that do not allow contact with atmospheric air (desiccation, wrapping, etc.).
Material balance.
 A tunnel dryer is usually used as a training one, because she has vehicles in the form of trolleys (drying bricks, wood, etc.). The installation diagram is shown in Fig. 172.
Fig. 172. Scheme of a tunnel dryer.
1-fan, 2-heater, 3-dryer, 4-trolleys, 5-exhaust air recycle line.
Designations:

Air flow and parameters before the heater, after it and after the dryer.

Rice. 1. Display of air treatment processes on a d-h diagram
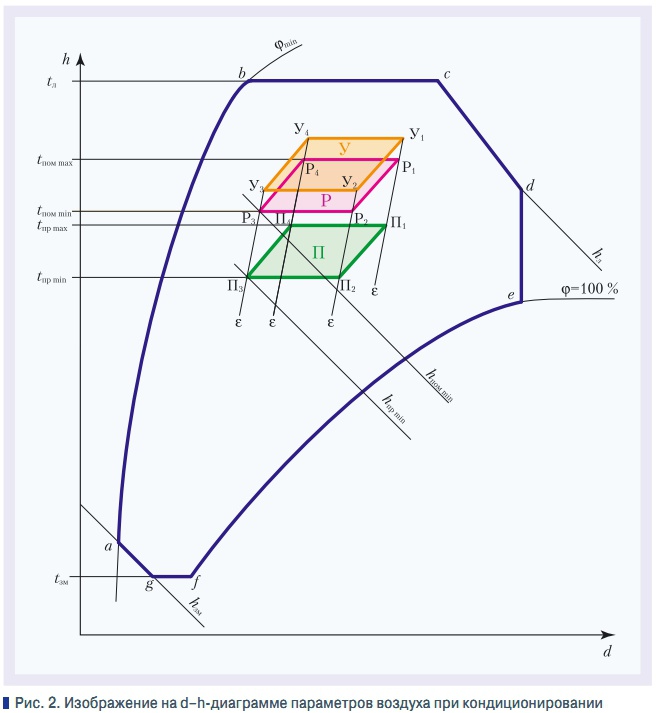
Rice. 2. Image on the d-h diagram of air parameters during air conditioning

Basic terms and definitions
Atmospheric air is a non-stratified mixture of gases (N2, O2, Ar, CO2, etc.), which is called dry air, and water vapor. The state of air is characterized by: temperature t [°C] or T [K], barometric pressure pb [Pa], absolute pabs = pb + 1 [bar] or partial ppar, density ρ [kg/m3], specific enthalpy (heat content) h [kJ/kg]. The state of moisture in atmospheric air is characterized by absolute humidity D [kg], relative humidity ϕ [%] or moisture content d [g/kg]. Pressure atmospheric air pb is the sum of the partial pressures of dry air pc and water vapor pp (Dalton’s law):
rb = rs + rp. (1)
If gases can be mixed in any quantity, then air can only accommodate a certain amount of water vapor, because the partial pressure of water vapor ppv in the mixture cannot be greater than the partial saturation pressure pH of these vapors at a given temperature. The existence of a limiting partial saturation pressure is manifested in the fact that all excess water vapor above this amount condenses.
In this case, moisture may fall out in the form of water droplets, ice crystals, fog or frost. Lowest content moisture in the air can be reduced to zero (at low temperatures), and the maximum is approximately 3% by mass or 4% by volume. Absolute humidity D - the amount of steam [kg] contained in one cubic meter of humid air:
where Mn is the steam mass, kg; L is the volume of moist air, m3. In practical calculations, the moisture content is taken as the unit of measurement characterizing the vapor content in moist air. Moisture content of moist air d - the amount of steam contained in a volume of moist air consisting of 1 kg of dry air and MW [g] steam:
d = 1000(Mp/Mc), (3)
where Mc is the mass of the dry part of moist air, kg. Relative humidity ϕ or degree of humidity, or hygrometric indicator, is the ratio of the partial pressure of water vapor to the partial pressure of saturated vapor, expressed as a percentage:
ϕ = (рп/рн)100% ≈ (d/dп)100%. (4)
Relative humidity can be determined by measuring the rate of evaporation of water. Naturally, the lower the humidity, the more active the evaporation of moisture will occur. If the thermometer is wrapped in a damp cloth, the thermometer readings will decrease relative to the dry thermometer. The difference in temperature readings between dry and wet thermometers gives a certain value for the degree of humidity in the atmospheric air.
The specific heat capacity of air c is the amount of heat required to heat 1 kg of air by 1 K. The specific heat capacity of dry air at constant pressure depends on temperature, however, for practical calculations of SCR systems, the specific heat capacity of both dry and moist air is:
ss.v = 1 kJ/(kg⋅K) = 0.24 kcal/(kg⋅K) = 0.28 W/(kg⋅K), (5)
The specific heat capacity of water vapor cp is taken equal to:
cn = 1.86 kJ/(kg⋅K) = 0.44 kcal/(kg⋅K) = 0.52 W/(kg⋅K), (6)
Dry or sensible heat is heat that is added to or removed from air without change state of aggregation steam (temperature changes). Latent heat is the heat used to change the aggregate state of steam without changing temperature (for example, drying). Enthalpy (heat content) of moist air hv.v is the amount of heat contained in a volume of moist air, the dry part of which weighs 1 kg.
Otherwise, this is the amount of heat that is necessary to heat from zero to a given temperature such an amount of air, the dry part of which is equal to 1 kg. Typically, the specific enthalpy of air is taken to be h = 0 at air temperature t = 0 and moisture content d = 0. The enthalpy of dry air hc.b is equal to:
hc.в = ct = 1.006t [kJ/kg], (7)
where c is the specific heat capacity of air, kJ/(kg⋅K). The enthalpy of 1 kg of water vapor is equal to:
hv.p = 2500 + 1.86t [kJ/kg], (8)
where 2500 is the latent heat of evaporation of 1 kg of water at a temperature of zero degrees, kJ/kg; 1.86 is the heat capacity of water vapor, kJ/(kg⋅K). At humid air temperature t and moisture content d, the enthalpy of moist air is equal to:
hv.v = 1.006t + (2500 +1.86t)×(d/1000) [kJ/kg], where d = (ϕ/1000)dn [g/kg], (9)
The heating and cooling capacity Q of an air conditioning system can be determined by the formula:
Q = m(h2 - h1) [kJ/h], (10)
where m is air flow, kg; h1, h2 are the initial and final enthalpies of air. If moist air is cooled while maintaining a constant moisture content, the enthalpy and temperature will decrease, and the relative humidity will increase. There will come a moment when the air becomes saturated and its relative humidity is 100%. At the same time, moisture will begin to evaporate from the air in the form of dew—steam condensation.
This temperature is called the dew point. The dew point temperature for various dry air temperatures and relative humidity is given in table. 1. The dew point is the limit of possible cooling of moist air with constant moisture content. To determine the dew point, it is necessary to find the temperature at which the moisture content of the air d will be equal to its moisture capacity dн.
Graphic construction of air treatment processes
To facilitate calculations, the equation for the heat content of moist air is presented in the form of a graph called a d-h diagram (in technical literature the term i-d diagram is sometimes used). In 1918, Professor of St. Petersburg University L.K. Ramzin proposed a d-h diagram, which clearly reflects the relationship between the parameters of moist air t, d, h, ϕ at a certain atmospheric pressure pb.
With the help of a d-h diagram, the graphical method is used to simply solve problems, the solution of which analytically requires, although simple, but painstaking calculations. In the technical literature there are various interpretations of this diagram, which have minor differences from the Ramzin d-h diagram.
These are, for example, the Mollier diagram, the Carrier diagram published by the American Society of Heating, Refrigeration and Air Conditioning (ASHRAE), and the French Association of Climate, Ventilation and Refrigeration Engineers (AICVF) diagram. The last diagram is very accurate and is printed in three colors.
However, in our country, the Ramzin diagram, as a rule, was widespread and is currently used. It is available in many textbooks and is used by design organizations. Therefore, we also took it as a basis (Fig. 1). This Ramzin d-h diagram was constructed in an oblique coordinate system. The enthalpy values h are plotted along the ordinate axis, and the moisture content d is plotted along the abscissa axis, located at an angle of 135° to the ordinate axis. The origin (point 0) corresponds to the values h = d = 0.
Below point 0 negative enthalpy values are deposited, above - positive ones. On the grid obtained in this way, lines of isotherms t = const, lines of constant relative humidity ϕ = const, partial pressure of water vapor and moisture content are constructed. The lower curve ϕ = 100% characterizes the saturated state of air and is called the boundary curve. As barometric pressure increases, the saturation line shifts upward, and as pressure decreases, it shifts downward.
Thus, when carrying out calculations for SCVs located in the Kiev area, it is necessary to use a diagram with barometric pressure pb = 745 mm Hg. Art. = 99 kPa. On the d-h diagram, the area located above the boundary curve (ϕ = 100%) is the area of unsaturated steam, and the area below the boundary curve is supersaturated moist air.
In this region, saturated air contains moisture in the liquid or solid phase. As a rule, this state of air is unstable, so the processes in it are not considered on the d-h diagram. On a d-h diagram, each point above the boundary curve reflects a certain state of air (temperature, moisture content, relative humidity, enthalpy, partial pressure of water vapor).
If air is subjected to a thermodynamic process, then its transition from one state (point A) to another (point B) corresponds to line A-B on the d-h diagram. In general, this is a curved line. However, we are only interested in the initial and final states of the air, and the intermediate states are not important, so a line can be represented as a straight line connecting the initial and final states of the air.
To determine a point on a d-h diagram corresponding to a certain state of air, it is enough to know two parameters independent of each other. The desired point is located at the intersection of lines corresponding to these parameters. By drawing perpendiculars to the lines on which other parameters are plotted, their values are determined. The dew point temperature is also determined on the d-h diagram.
Since the dew point temperature is the lowest temperature to which the air can be cooled at constant moisture content, to find the dew point it is enough to draw the line d = const to the intersection with the curve ϕ = 100%. The point of intersection of these lines is the dew point, and the corresponding temperature is the dew point temperature. Using a d-h diagram, you can determine the air temperature using a wet bulb thermometer.
To do this, from a point with given air parameters we draw an isenthalpe (h = const) until it intersects with the line ϕ = 100%. The temperature corresponding to the intersection of these lines is the wet bulb temperature. The technical documentation for air conditioners specifies the conditions under which the nominal cooling capacity was measured. Typically this is the dry and wet bulb temperature corresponding to 50% relative humidity.
Air heating process
When air is heated, the thermodynamic process line passes along straight A-B with constant moisture content (d = const). Air temperature and enthalpy increase and relative humidity decreases. The heat consumption for heating the air is equal to the difference between the enthalpies of the final and initial states of the air.
Air cooling process
The process of air cooling on the d-h diagram is reflected by a straight line directed vertically downward (straight A-C). The calculation is carried out similarly to the heating process. However, if the cooling line goes below the saturation line, then the cooling process will follow straight A-C and then along the line ϕ = 100% from point C1 to point C2. Parameters of point C2: d = 4.0 g/kg, t = 0.5 °C.
The process of drying humid air
Drying of moist air by absorbents without changing the heat content (without heat removal or supply) occurs along the straight line h = const, that is, along straight A-D, directed up and to the left (straight A-D1). At the same time, the moisture content and relative humidity decrease, and the air temperature increases, because During the absorption process, steam condenses on the surface of the absorbent, and the released latent heat of the steam turns into sensible heat. The limit of this process is the point of intersection of the straight line h = const with the ordinate d = 0 (point D1). The air at this point is completely free of moisture.
Adiabatic air humidification and cooling
Adiabatic humidification and cooling (no heat exchange c external environment) on the d-h diagram from the initial state (point N) is reflected by a straight line directed down h = const (point K). The process occurs when air comes into contact with water, constantly circulating in a reversible cycle. At the same time, the air temperature drops, the moisture content and relative humidity increase.
The limit of the process is the point on the curve ϕ = 100%, which is the wet bulb temperature. At the same time, the recirculating water must reach the same temperature. However, in real SCR during adiabatic processes of air cooling and humidification, the point ϕ = 100% is somewhat not reached.
Mixing air with different parameters
On the d-h diagram, the parameters of mixed air (with parameters corresponding to points (X and Y) can be obtained as follows. We connect points X and Y with a straight line. The parameters of mixed air lie on this straight line, and point Z divides it into segments inversely proportional to the air mass each of components. If we denote the proportion of the mixture n = Gx/Gy, then so that straight X-Y to find point Z, you need to divide the straight line X-Y into the number of parts n + 1 and set off a segment equal to one part from point X.
The mixture point will always be closer to the parameters of the air whose dry part has a larger mass. When mixing two volumes of unsaturated air with states corresponding to points X1 and Y1, it may happen that the straight line X1-Y1 intersects the saturation curve ϕ = 100% and point Z1 ends up in the fog formation region. This position of the mixture point Z2 shows that as a result of mixing, moisture will fall out of the air.
In this case, the mixture point Z1 will go into a more stable state on the saturation curve ϕ = 100% at point Z2 along the isenthalp. In this case, for every kilogram of the mixture dZ1 - dZ2 grams of moisture fall.
Slope on d-h diagram
Attitude:
ε = (h2 - h1)/(d2 - d1) = Δh/Δd (11)
uniquely determines the nature of the process of change in humid air. Moreover, the values of Δh and Δd may have a “+” or “-” sign, or they may be equal to zero. The quantity ε is called the heat-moisture ratio of the process of changing moist air, and when the process is depicted by a ray on a d-h diagram, it is called the angular coefficient:
ε = 1000(Δh/Δd) = ±(Qg/Mv), kJ/kg,(12)
Thus, the angular coefficient is equal to the ratio of excess heat to the mass of released moisture. The angular coefficient is depicted by ray segments on the field frame of the d-h diagram (scale of angular coefficients). So, to determine the slope X-Z process it is necessary to draw a straight line parallel to the X-Z process line from point 0 (on the temperature scale) to the scale of angular coefficients. In this case line O-N will indicate a slope equal to 9000 kJ/kg.
Thermodynamic model of SCR
The process of preparing air before supplying it to a conditioned room constitutes a set of technological operations and is called air conditioning technology. The technology for heat and humidity treatment of conditioned air is determined by the initial parameters of the air supplied to the air conditioner and the required (set) parameters of the air in the room.
To select air treatment methods, a d-h diagram is constructed, which allows, given certain initial data, to find a technology that will ensure that the specified air parameters in the serviced room are obtained with minimal consumption of energy, water, air, etc. Graphic display air handling processes on the d-h diagram is called the thermodynamic model of the air conditioning system (TDM).
The parameters of the outside air supplied to the air conditioner for subsequent processing vary throughout the year and day over a wide range. Therefore, we can talk about outside air as a multidimensional function Xн = хн(t). Accordingly, the set of supply air parameters is a multidimensional function Xpr = xpr(t), and in the serviced room Xpom = xpom(t) (parameters in the work area).
A technological process is an analytical or graphical description of the process of movement of a multidimensional function Xn to Xpr and further to Xpom. Note that the variable state of the system x(ϕ) refers to the generalized indicators of the system at different points in space and at different times. A thermodynamic model of the movement of the function Xn to Xpom is built on a d-h diagram, and then an air processing algorithm, the necessary equipment and a method for automatically regulating air parameters are determined.
The construction of a TDM begins by plotting the state of the outside air of a given geographical point. The calculated area of possible conditions of outdoor air is accepted according to SNiP 2.04.05-91 (parameters B). The upper limit is the isotherm tl and isenthalpe hl (limit parameters of the warm period of the year). Lower limit is isotherm tzm and isenthalpe hzm (limiting parameters of the cold and transition periods of the year).
Limit values of relative humidity of outdoor air are taken based on the results of meteorological observations. In the absence of data, a range from 20 to 100% is accepted. Thus, the multidimensional function of possible outdoor air parameters is contained in the polygon abcdefg (Fig. 2). Then the required (calculated) value of the air condition in the room or in the work area is plotted on the d-h diagram.
This can be a point (precision air conditioning) or a work zone P1P2P3P4 (comfort air conditioning). Next, the angular coefficient of change in air parameters in the room ε is determined and process lines are drawn through the boundary points of the working area. In the absence of data on the heat-humidity process in the room, it can be approximately taken in kJ/kg: trade enterprises and Catering- 8500-10000; auditoriums - 8500-10000; apartments - 15000-17000; office space - 17,000-20,000.
After this, a zone of supply air parameters is built. To do this, on the lines ε drawn from the boundary points of the zone Р1Р2Р3Р4, segments corresponding to the calculated temperature difference are plotted:
Δt = tpom - tpr, (13)
where tpr is the design temperature of the supply air. Solving the problem comes down to converting air parameters from the multidimensional function Xn to the Xpom function. The value of Δt is taken according to standards or calculated based on the parameters of the refrigeration system. For example, when using water as a coolant, the final temperature of water in the irrigation chamber tw will be:
tw = t2 + Δt1 + Δt2 + Δt3, (14)
where t1 is the water temperature at the chiller outlet (5-7 °C); Δt1 — increase in water temperature in the pipeline from the chiller to the water heat exchanger of the air conditioner (1 °C); Δt2 — heating of water in the irrigation chamber (2-3 °C); Δt3 - water heating due to the bypass coefficient (1°C). Thus, the temperature of the water in contact with the air will be tw = 9-12 °C. In practice, air humidity reaches a value of no more than ϕ = 95%, which increases tw to 10-13 °C. The supply air temperature will be:
tw = t2 + Δt2 + Δt3 + Δt4, (15)
where Δt4 is the air heating in the fan (1-2 °C); Δt5 - heating of air in the supply air duct (1-2 °C). Thus, the supply air temperature will be 12-17 °C. The permissible temperature difference between the exhaust and supply air Δt for industrial premises is 6-9 °C, for sales areas - 4-10 °C, and for a room height of more than 3 m - 12-14 °C.
In general, the parameters of the air removed from the room differ from the parameters of the air in the work area. The difference between them depends on the method of supplying air to the room, the height of the room, the frequency of air exchange and other factors. Zones U, P and P on the d-h diagram have the same shape and are located along the line ε at distances corresponding to the temperature differences: Δt1 = troom - tpr and Δt2 = tsp - troom. The relationship between tpr, tpom and t is estimated by the coefficient:
m1 = (tpom - tpr)/(tsp - tpr) = (hpom - hpr)/(hsp - hpr),(16)
Thus, the air conditioning process comes down to bringing a set of parameters of external air (polygon abcdef) to an acceptable set of parameters of supply air (polygon P1P2P3P4). When designing, as a rule, electronic d-h diagrams, various versions of which can be found on the Internet.
One of the most common diagrams is the diagram developed by Daichi (Moscow), www.daichi.ru. Using this diagram, you can find the parameters of moist air at different barometric pressures, build process lines, determine the parameters of a mixture of two air flows, etc. The technical implementation of this transformation can be represented by various structural diagrams SCR: direct-flow, with air recirculation or heat recovery, which will be discussed in subsequent issues of our magazine.
Atmospheric air always contains some amount of moisture in the form of water vapor. This mixture of dry air and water vapor is called moist air. In addition to water vapor, moist air can contain tiny droplets of water (in the form of fog) or ice crystals (snow, ice fog). Water vapor in humid air can be saturated or superheated. A mixture of dry air and saturated water vapor is called rich humid air. A mixture of dry air and superheated water vapor is called unsaturated humid air. At low (close to atmospheric) pressures, with sufficient accuracy for technical calculations, both dry air and water vapor can be considered as ideal gases. When calculating processes with moist air, 1 kg of dry air is usually considered. The variable is the amount of steam contained in the mixture. Therefore, all specific values characterizing moist air refer to 1 kg of dry air (and not to the mixture).
Thermodynamic properties of moist air are characterized by the following state parameters: dry bulb temperature t c; moisture content d, enthalpy I, relative humidity φ. In addition, other parameters are used in the calculations: wet thermometer temperature t m, dew point temperature t p, air density ρ, absolute humidity e, partial pressure of water vapor p p.
Temperature − thermodynamic quantity that determines the degree of heating of a body. Currently, various temperature scales are used: Celsius (t, ºС), Kelvin (T, K), Fahrenheit (f, ºF), etc. The relationships between the readings on these scales are determined by the following equations:
T K = t ºС +273,
t ºС = 5/9 (f ºF − 32),
f ºF = 9/5 t ºС +32.
Pressure atmospheric air p b (Pa) is equal to the sum of the partial pressures of dry air p s.v and water vapor p p (Dalton’s law):
r b = r s.v + r p. (1)
The partial pressure of water vapor in atmospheric air is determined by the formula:
r n = φ·r n, (2)
where φ is the relative air humidity, %; р n is the saturation pressure, determined from tables of saturated water vapor at the corresponding temperature, Pa.
Density atmospheric air is equal to the sum of the densities of dry air and water vapor:
ρ = ρ s.v + ρ p. (3)
Applying the equation of state of an ideal gas: , we obtain:
 (4)
(4)
where R d.v = 287 J/(kg K) is the specific gas constant of dry air;
R p = 463 J/(kg K) – specific gas constant of water vapor.
At atmospheric pressure p b = 101.325 kPa, the density of dry air is equal to:
 . (5)
. (5)
At t = 0 ºС and p b = 101.325 kPa, the density of dry air is ρ d.v = 1.293 kg/m 3.
The density of atmospheric air is equal to:
![]() . (6)
. (6)
From equation (6) it is clear that atmospheric (moist) air is lighter than dry air at the same temperatures and pressures, and an increase in the content of water vapor in the air reduces its density. Since the difference in the values of ρ r.v. and ρ is insignificant, in practical calculations they take ρ ≈ ρ r.v.
Humidity. There are absolute humidity, moisture content and relative humidity.
Absolute humidity e is the mass of water vapor (kg) contained in 1 m3 of moist air. Absolute humidity can be expressed as the vapor density of a mixture at its partial pressure and temperature of the mixture and is determined by the formula:
 . (7)
. (7)
The maximum possible absolute humidity corresponds to the saturation state and is called moisture capacity.
Using the ideal gas equation of state, we obtain:
Relative humidityφ is equal to the ratio absolute humidity air ρ p to the maximum possible absolute humidity ρ n (moisture capacity) at a given temperature. It shows the degree of saturation of air with water vapor in relation to the state of complete saturation. For ideal gases, the density ratio can be replaced by the ratio of the partial pressures of the components.
Relative humidity is determined by the formula:
 . (10)
At φ< 100% воздух ненасыщенный, при φ = 100% воздух полностью насыщен водяными парами, и его называют насыщенным.
Air saturation degreeΨ is the ratio of the moisture contents of unsaturated and saturated air and is determined by the formula:
 . (11)
Heat capacity humid air usually refers to (1 + d) kg of humid air and is determined by the formula:
s in = s s.v + d s p, (12)
where c.v and c.p are the specific heat capacity at constant pressure of dry air and water vapor, respectively, kJ/(kg K).
For the temperature range from minus 50 °C to 50 °C, the specific heat capacities of dry air and steam can be considered constant: c.v = 1.006 kJ/(kg K), c p = 1.86 kJ/(kg K).
Enthalpy moist air is defined as the enthalpy of a gas mixture consisting of 1 kg of dry air and d kg of water vapor, and is determined by the formula:
I = i s.v + d i p (13)
where i s.v is the specific enthalpy of dry air, kJ/kg; i p is the specific enthalpy of water vapor contained in moist air kJ/kg.
The enthalpies of dry air and water vapor are determined by the formulas:
i s.v = s.v ·t = 1.006·t, (14)
i p = r + c p ·t. (15)
where r is the latent heat of vaporization at the partial pressure of water vapor in the mixture, kJ/kg.
The latent heat of vaporization r for tH values from 0 °C to 100 °C can be expressed by the formula:
r = 2500 − 2.3 t n.
When calculating the enthalpy of mixtures, it is always very important to have the same reference point for the enthalpies of each component. Let us take enthalpy as the reference point at t = 0 ºС and d = 0. For atmospheric air, enthalpy determines the amount of heat that must be supplied to the air, the dry part of which has a mass of 1 kg, in order to change its state from the initial one (I = 0 kJ/kg ) before this. Enthalpy can be positive or negative.
Substituting the obtained relations into formula (13) leads it to the form:
Dew point temperature t p− this is the air temperature to which it is necessary to cool unsaturated humid air so that the superheated steam contained in it becomes saturated. With further cooling of moist air (below the dew point temperature), water vapor condenses.
Wet bulb temperature. An instrument called a psychrometer is often used to measure humidity. It consists of two thermometers - dry and wet. A wet thermometer is characterized by the fact that the sensitive element is wrapped in a cloth moistened with water. A dry thermometer shows the temperature of moist air; its readings are called dry bulb temperature t s. A wet thermometer shows the temperature of the water contained in wet fabric. When air is blown onto a wet thermometer, water evaporates from the surface of the wet fabric. Since the heat of vaporization is expended on the evaporation of moisture, the temperature of the wet fabric will decrease, therefore such a thermometer always shows more low temperature than a dry bulb thermometer. When there is a temperature difference between air and water, a heat flow occurs from air to water. When the heat received by water from the air becomes equal to the heat expended on evaporation, the increase in water temperature stops. This equilibrium temperature is called wet bulb temperature t m . If water enters a certain volume of air at a temperature t m, then due to the evaporation of part of this water, after some time the air becomes saturated. This saturation process is called adiabatic. Under these conditions, all the heat supplied from the air to the water is spent only on evaporation, and then returns with the steam back into the air.
I-d diagram of humid air
The moist air diagram gives a graphical representation of the relationship between the parameters of moist air and is the main one for determining the parameters of the state of the air and calculating the processes of heat and humidity treatment.
IN I-d diagram(Fig. 2) the abscissa axis shows the moisture content d g/kg of dry air, and the ordinate axis shows the enthalpy I of moist air. The diagram shows vertical straight lines of constant moisture content (d = const). Point O is taken as the starting point, at which t = 0 °C, d = 0 g/kg and, therefore, I = 0 kJ/kg. When constructing the diagram, an oblique coordinate system was used to increase the area of unsaturated air. The angle between the direction of the axes is 135° or 150°. For ease of use, a conditional axis of moisture content is drawn at an angle of 90º to the enthalpy axis. The diagram is plotted for constant barometric pressure. Use I-d diagrams constructed for atmospheric pressure p b = 99.3 kPa (745 mm Hg) and atmospheric pressure p b = 101.3 kPa (760 mm Hg).
The diagram shows isotherms (t c = const) and relative humidity curves (φ = const). Equation (16) shows that the isotherms in the I-d diagram are straight lines. The entire diagram field is divided into two parts by the line φ = 100%. Above this line is an area of unsaturated air. On the line φ = 100% are the parameters of saturated air. Below this line are the parameters of the state of saturated air containing suspended droplet moisture (fog).
For convenience of work, a dependence is plotted in the lower part of the diagram, a line of partial pressure of water vapor p p is plotted on the moisture content d. The pressure scale is located on the right side of the diagram. Each point on the I-d diagram corresponds to a certain state of humid air.

Determination of humid air parameters using the I-d diagram. The method for determining the parameters is shown in Fig. 2. The position of point A is determined by two parameters, for example, temperature t A and relative humidity φ A. We determine graphically: dry thermometer temperature t c, moisture content d A, enthalpy I A. Dew point temperature t p is defined as the temperature of the point of intersection of the line d A = const with line φ = 100% (point P). Air parameters in a state of complete saturation with moisture are determined at the intersection of the t A isotherm with the line φ = 100% (point H).
The process of air humidification without supplying or removing heat will take place at a constant enthalpy I A = const ( A-M process). At the intersection of the line I A = const with the line φ = 100% (point M), we find the wet thermometer temperature t m (the line of constant enthalpy practically coincides with the isotherm
t m = const). In unsaturated, humid air, the wet-bulb temperature is lower than the dry-bulb temperature.
We find the partial pressure of water vapor p P by drawing a line d A = const from point A until it intersects with the partial pressure line.
The temperature difference t c – t m = Δt ps is called psychrometric, and the temperature difference t c – t p hygrometric.


